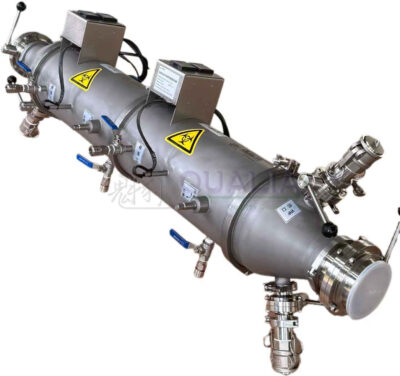
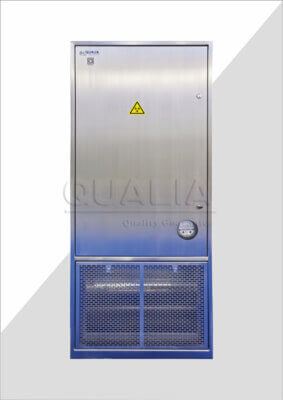
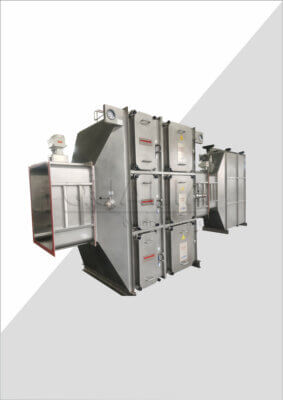
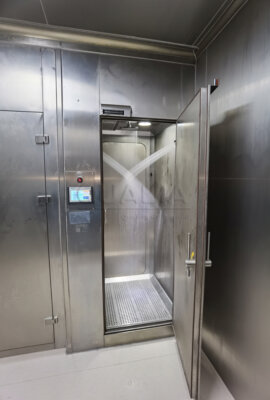
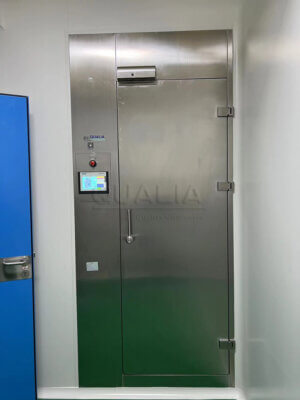
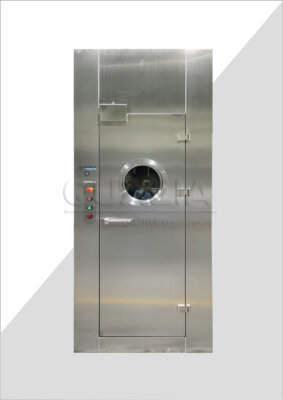
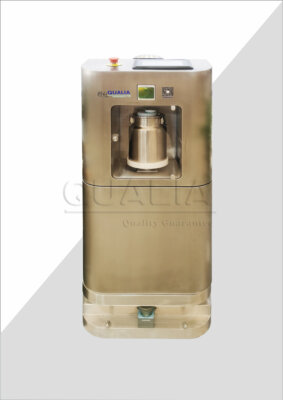
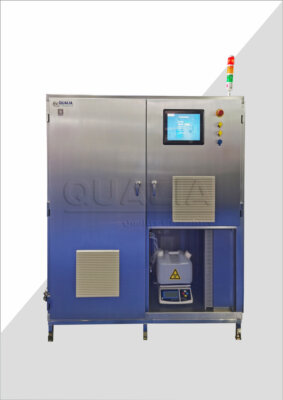
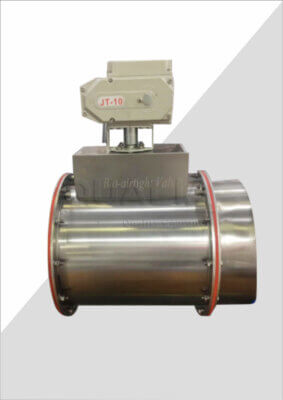
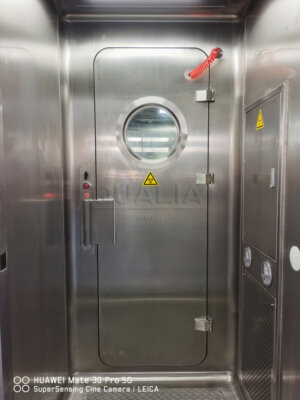
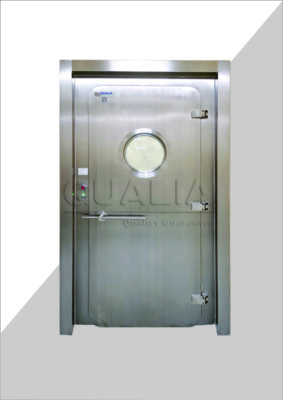
QUALIA Bio-Tech defines BIBO (Bag-In-Bag-Out) cost analysis as a comprehensive financial evaluation methodology that quantifies all direct and indirect expenses associated with implementing and operating contained filtration systems. This analysis extends beyond simple equipment pricing to encompass installation costs, training requirements, consumable expenses, maintenance schedules, and productivity impacts across the entire system lifecycle.
The significance of thorough BIBO cost analysis becomes apparent when considering the typical 10-15 year operational lifespan of industrial containment systems. According to industry research from the International Society for Pharmaceutical Engineering, organizations that conduct comprehensive upfront cost analysis achieve 23% better ROI performance compared to those using simplified procurement approaches. This performance differential stems from better alignment between system capabilities and actual operational requirements.
However, BIBO cost analysis presents unique challenges due to the specialized nature of containment applications. Variable factors such as filter replacement frequencies, decontamination protocols, and operator training requirements can significantly impact long-term expenses. Additionally, the indirect benefits of improved contamination control – including reduced product loss, enhanced regulatory compliance, and improved worker safety – require sophisticated valuation methodologies to quantify accurately.
How to Calculate BIBO System Total Cost of Ownership?
Initial Equipment Investment Considerations
BIBO system equipment costs typically represent 35-45% of total ownership expenses over a ten-year period. Base equipment pricing for industrial BIBO systems ranges from $15,000 to $85,000 depending on airflow capacity, containment level requirements, and automation features. However, the initial investment calculation must include several critical components beyond the core filtration unit.
Installation and commissioning expenses often add 20-30% to base equipment costs. These expenses include electrical connections, ductwork modifications, control system integration, and initial performance qualification testing. For facilities requiring specialized mounting configurations or custom integration with existing process equipment, installation costs may reach 40-50% of equipment value.
Training and certification requirements represent another significant upfront investment. Proper BIBO system operation requires specialized training for maintenance personnel, operators, and safety coordinators. Industry benchmarks suggest budgeting $2,000-5,000 per trained individual, with most implementations requiring training for 6-12 personnel across different operational roles.
| Cost Category | Percentage of Equipment Cost | Typical Range |
|---|---|---|
| Base Equipment | 100% | $15,000 – $85,000 |
| Installation & Commissioning | 20-30% | $3,000 – $25,500 |
| Initial Training | 5-15% | $750 – $12,750 |
| Validation & Documentation | 8-12% | $1,200 – $10,200 |
Operational and Maintenance Cost Factors
Ongoing operational expenses represent the largest component of BIBO system total cost of ownership. Filter replacement costs alone typically account for 15-25% of annual operational expenses. High-efficiency particulate filters used in BIBO systems cost $200-800 per unit, with replacement frequencies varying from 6-24 months depending on application conditions and contamination loads.
Preventive maintenance schedules significantly impact long-term cost performance. Well-maintained BIBO systems demonstrate 40% longer operational lifespans compared to systems receiving minimal maintenance attention. Comprehensive maintenance programs typically cost $3,000-8,000 annually but prevent costly emergency repairs and unplanned downtime events that can exceed $15,000 per incident.
Energy consumption represents an often-overlooked operational expense category. BIBO systems operating continuously consume 2-8 kW depending on airflow requirements and motor efficiency ratings. At industrial electricity rates averaging $0.08-0.12 per kWh, annual energy costs range from $1,400-6,700 per system. Energy-efficient motor upgrades can reduce these costs by 20-30% while improving overall system reliability.
Hidden Costs in BIBO Implementation
Documentation and compliance costs frequently surprise organizations during BIBO implementation. Regulatory documentation requirements for pharmaceutical applications can cost $5,000-15,000 per system, including change control documentation, risk assessments, and ongoing compliance monitoring protocols. These expenses recur during major maintenance events or system modifications.
Productivity impacts during implementation represent another hidden cost category. System installation and operator training typically reduce facility productivity by 10-15% during 2-4 week implementation periods. For facilities generating $50,000-200,000 weekly revenue, these productivity impacts can cost $10,000-60,000 per implementation.
Space utilization costs also merit consideration in comprehensive cost analysis. BIBO filter systems require dedicated floor space and clearance areas for safe operation and maintenance access. In high-value cleanroom environments where space costs $500-1,200 per square foot annually, the 20-40 square feet required for typical BIBO installations represents $10,000-48,000 in annual facility costs.
What Factors Drive BIBO Filter Housing ROI Analysis?
Contamination Prevention Value Quantification
The primary value proposition of BIBO systems lies in their superior contamination prevention capabilities compared to conventional filtration approaches. Quantifying contamination prevention benefits requires analysis of potential product loss scenarios, regulatory penalty risks, and worker exposure reduction values. Industry data indicates that contained filtration systems prevent 85-95% of operator exposure incidents compared to traditional filter handling methods.
Product loss prevention represents the most tangible ROI driver for pharmaceutical manufacturers. High-potency drug manufacturing operations report product loss rates of 0.5-2.0% when using conventional filtration systems. BIBO implementation typically reduces product loss to 0.1-0.3% through improved containment control. For facilities processing $10-50 million annual product volumes, this improvement generates $45,000-995,000 in annual product loss prevention value.
Environmental contamination prevention provides additional ROI through reduced cleaning and decontamination requirements. Facilities using BIBO systems report 60-80% reduction in post-filtration cleaning time requirements. This efficiency improvement translates to labor cost savings of $15,000-40,000 annually for typical pharmaceutical manufacturing operations.
Labor Efficiency and Safety Cost Savings
BIBO systems significantly improve operator safety by eliminating direct filter handling requirements during replacement operations. Traditional filter replacement procedures expose operators to potential contamination risks and require extensive personal protective equipment protocols. BIBO bag-in-bag-out procedures reduce filter replacement time by 40-60% while virtually eliminating operator exposure risks.
Safety cost savings extend beyond direct labor efficiency to include reduced insurance premiums, lower worker compensation claims, and decreased regulatory inspection frequency. Organizations implementing comprehensive containment programs report 25-40% reduction in safety-related insurance costs. These savings typically amount to $5,000-15,000 annually for mid-sized pharmaceutical manufacturing facilities.
Training cost reduction represents another significant labor-related ROI driver. BIBO systems require less specialized training compared to complex glovebox or isolator systems. Reduced training requirements decrease onboarding time for new operators by 2-3 days, saving $800-1,200 per new hire in training-related expenses.
| ROI Factor | Annual Value Range | Quantification Method |
|---|---|---|
| Product Loss Prevention | $45,000 – $995,000 | Volume × Loss Rate Reduction × Product Value |
| Labor Efficiency Gains | $15,000 – $40,000 | Time Savings × Labor Rate |
| Safety Cost Reduction | $5,000 – $15,000 | Insurance Premium Reduction |
| Training Cost Savings | $800 – $1,200 per hire | Reduced Training Hours × Training Cost Rate |
Regulatory Compliance Cost Benefits
Regulatory compliance represents a critical ROI component that’s often difficult to quantify precisely but carries substantial financial implications. BIBO systems help organizations meet increasingly stringent containment requirements established by FDA, EMA, and other regulatory authorities. Compliance failures can result in warning letters, manufacturing delays, or product recalls costing millions of dollars.
Documentation benefits of BIBO systems include simplified validation protocols and reduced ongoing compliance monitoring requirements. The contained design eliminates many environmental monitoring points required for open filtration systems. This simplification reduces validation costs by 20-30% and ongoing compliance monitoring expenses by $8,000-15,000 annually.
Regulatory inspection advantages also provide significant value. Facilities using advanced containment systems like BIBO demonstrate proactive safety commitment to regulatory inspectors. This positive impression can influence inspection outcomes and reduce the likelihood of regulatory citations that require costly corrective actions.
How Does BIBO System Pricing Compare to Alternative Containment Solutions?
Traditional Filter Housing vs BIBO Systems
Conventional filter housing systems typically cost 25-40% less than equivalent BIBO systems in terms of initial equipment investment. However, this apparent cost advantage diminishes rapidly when operational expenses are considered over multi-year periods. Traditional systems require significantly higher labor costs for filter replacement procedures and generate higher operator exposure risks that translate to increased safety-related expenses.
Filter replacement labor costs represent the most significant operational difference between traditional and BIBO systems. Conventional filter replacements require 2-4 hours per event including preparation, replacement, and post-replacement cleaning procedures. BIBO systems complete similar replacements in 30-60 minutes with minimal cleanup requirements. Over typical 2-3 filter replacements annually, this efficiency difference saves $3,000-8,000 in labor costs per year.
Validation and compliance costs also favor BIBO systems over extended periods. Traditional filter housings require more extensive environmental monitoring and documentation procedures. These additional requirements typically add $5,000-12,000 in annual compliance-related expenses compared to contained BIBO alternatives.
Isolator Systems Cost Comparison
Isolator systems represent the premium containment option, with initial costs typically 200-400% higher than equivalent BIBO systems. While isolators provide superior containment performance for extremely hazardous materials, their cost-benefit profile often doesn’t justify the investment for moderate containment applications where BIBO systems provide adequate protection.
Operational complexity represents a significant disadvantage for isolator systems. These systems require specialized maintenance expertise, expensive replacement parts, and complex validation procedures. Annual maintenance costs for isolator systems typically range from $15,000-35,000 compared to $3,000-8,000 for BIBO systems with equivalent filtration capacity.
However, isolator systems may provide better long-term value for applications involving extremely high-value products or maximum containment requirements. For facilities processing products worth more than $10,000 per kilogram, the additional contamination protection provided by isolators can justify their higher costs through reduced product loss risks.
Disposable vs Reusable Containment Options
Disposable containment systems offer lower initial investment requirements but generate higher long-term operational costs through recurring consumable expenses. Single-use containment solutions typically cost $500-2,000 per operational cycle compared to $50-200 per cycle for reusable BIBO systems. For facilities operating more than 10-15 filtration cycles annually, reusable BIBO systems provide superior cost performance.
Environmental considerations increasingly influence containment system selection decisions. Disposable systems generate 5-10 times more waste volume compared to reusable alternatives. Growing waste disposal costs and environmental regulations make disposable options less attractive for high-volume operations. Waste disposal costs for disposable containment can reach $5,000-15,000 annually for busy pharmaceutical facilities.
Flexibility advantages of disposable systems include reduced validation requirements and simplified change control procedures. These benefits may justify higher operational costs for research and development applications or low-volume production scenarios where operational flexibility outweighs cost efficiency considerations.
What Are the Key Variables in BIBO Investment Analysis?
Facility Size and Throughput Requirements
Facility throughput directly impacts BIBO system cost-effectiveness through economies of scale in both equipment utilization and operational efficiency. High-throughput facilities processing more than 500 kg annually typically achieve better ROI performance from BIBO investments compared to low-volume operations. The fixed costs associated with system validation, training, and maintenance are amortized across larger production volumes.
Right-sizing BIBO systems for specific facility requirements prevents both under-capacity bottlenecks and over-capacity waste. Systems operating at 60-80% of rated capacity demonstrate optimal cost performance by maintaining adequate capacity reserves while maximizing equipment utilization. Undersized systems operating above 90% capacity experience accelerated wear rates and higher maintenance costs.
Multi-product facilities require additional analysis complexity due to varying contamination risks and throughput patterns across different product lines. Shared BIBO systems serving multiple products may require more frequent filter changes and additional cleaning validation procedures. These requirements can increase operational costs by 15-25% compared to dedicated single-product implementations.
Contamination Risk Assessment Metrics
Contamination risk levels significantly influence BIBO system ROI through their impact on required containment performance and associated operational procedures. High-risk applications justify premium system features such as redundant filtration stages, enhanced monitoring systems, and automated operation controls. These features increase initial costs by 20-40% but provide corresponding risk reduction benefits.
Quantitative risk assessment methodologies help optimize BIBO system specifications for specific applications. Risk-based approaches consider factors such as material toxicity, exposure duration, operator proximity, and potential exposure pathways. Applications with calculated risk scores above 75 (on a 100-point scale) typically justify enhanced BIBO system configurations despite higher costs.
Risk mitigation value varies significantly across different industries and applications. Pharmaceutical manufacturers processing oncology compounds may value risk reduction at $500,000-2,000,000 per prevented exposure incident. Chemical manufacturers handling industrial compounds typically assign lower valuations of $50,000-200,000 per incident. These valuation differences significantly impact optimal BIBO system investment levels.
Long-term Scalability Considerations
Scalability planning significantly impacts BIBO investment analysis for growing organizations or facilities with expanding production requirements. Modular BIBO system designs allow incremental capacity additions without complete system replacement. This flexibility provides option value that should be quantified in comprehensive investment analysis frameworks.
Technology evolution rates also influence optimal investment timing and system selection decisions. BIBO system technology improvements typically occur on 5-7 year cycles, introducing enhanced efficiency features and improved safety capabilities. Organizations planning 15+ year operational lifecycles should consider technology refresh strategies in their investment analysis models.
Future regulatory requirements represent another critical scalability factor. Increasingly stringent containment regulations may require system upgrades or replacements during planned operational lifecycles. Building regulatory buffer capacity into initial BIBO system specifications can prevent costly premature replacements while providing insurance against evolving compliance requirements.
How to Build an Effective BIBO Cost Analysis Calculator?
Essential Cost Categories to Include
Effective BIBO cost calculators must capture all significant cost categories while remaining user-friendly for typical decision-making scenarios. Primary cost categories include initial equipment investment, installation and commissioning, training and validation, operational consumables, maintenance and service, energy consumption, and facility/space costs. Each category requires subcategory detail sufficient for accurate cost estimation without excessive complexity.
Time-value-of-money considerations require proper discount rate selection and cash flow timing assumptions. Industrial equipment analysis typically uses 8-12% discount rates depending on organizational cost of capital and risk assessment. BIBO systems generate relatively predictable cash flows that justify discount rates toward the lower end of this range for most applications.
Sensitivity analysis capabilities allow users to understand how input variable changes impact overall ROI calculations. Key sensitivity variables include filter replacement frequency, labor rates, energy costs, and throughput volumes. Monte Carlo simulation approaches can model uncertainty ranges for critical input parameters, providing decision-makers with confidence intervals around calculated ROI estimates.
ROI Calculation Methodologies
Net Present Value (NPV) calculations provide the most comprehensive ROI metric for BIBO investment analysis. NPV analysis requires careful cash flow modeling including initial investment, annual operational costs, periodic major maintenance expenses, and end-of-life salvage values. Positive NPV indicates economically justified investments while negative NPV suggests alternative solutions may provide better value.
Payback period calculations offer intuitive supplementary metrics that complement NPV analysis. Simple payback periods for BIBO systems typically range from 1.5-4.5 years depending on application intensity and cost savings opportunities. Discounted payback calculations provide more accurate assessment by incorporating time-value-of-money considerations into payback timeline analysis.
Internal Rate of Return (IRR) calculations help compare BIBO investments against alternative capital allocation opportunities within organizations. BIBO systems with calculated IRRs exceeding organizational hurdle rates represent attractive investment opportunities. However, IRR calculations can produce misleading results for projects with unusual cash flow patterns, making NPV the preferred primary decision metric.
| ROI Metric | Calculation Complexity | Decision Insight Provided |
|---|---|---|
| Net Present Value | High | Absolute value creation amount |
| Payback Period | Low | Time to recover initial investment |
| Internal Rate of Return | Medium | Equivalent annual return percentage |
| Profitability Index | Medium | Value creation per dollar invested |
Sensitivity Analysis for Decision Making
Sensitivity analysis reveals which input parameters most significantly impact BIBO investment attractiveness, helping decision-makers focus attention on critical assumptions and identify risk factors requiring additional analysis. Tornado diagrams effectively visualize sensitivity analysis results by showing ROI impact ranges for each key variable.
Scenario modeling allows evaluation of BIBO performance under different operational conditions or market environments. Base case, optimistic, and pessimistic scenarios help quantify investment risk and identify conditions where BIBO systems provide most value. Decision trees can model complex scenarios involving multiple uncertain variables and sequential decision points.
Break-even analysis identifies threshold values for critical parameters where BIBO investments transition from negative to positive ROI. Understanding these thresholds helps organizations assess implementation feasibility and identify operational targets required for successful ROI achievement. Common break-even variables include minimum throughput volumes, maximum filter replacement costs, and required product loss prevention percentages.
In our experience working with pharmaceutical and biotechnology manufacturers, organizations that invest time in comprehensive BIBO cost analysis achieve significantly better long-term satisfaction with their containment system investments. The structured approach outlined in this guide provides the analytical framework necessary for confident decision-making while avoiding common cost analysis pitfalls that lead to suboptimal system selection.
The key to successful BIBO cost analysis lies in balancing analytical rigor with practical usability, ensuring that decision-makers have access to accurate financial projections without becoming overwhelmed by excessive complexity. Organizations ready to move forward with BIBO implementation should conduct pilot cost analysis using actual facility data to validate their analytical assumptions and refine their ROI calculations. For detailed technical specifications and pricing information, explore comprehensive BIBO system solutions designed to meet diverse containment requirements while optimizing total cost performance.
As containment technology continues advancing and regulatory requirements evolve, the organizations best positioned for success will be those that develop robust analytical capabilities for evaluating new technologies and making data-driven investment decisions that balance safety, compliance, and economic performance objectives.
Frequently Asked Questions
Q: What is BIBO, and how does it compare to other filter systems in terms of cost?
A: BIBO stands for Bag In Bag Out, a system designed to enhance safety and efficiency in filter change processes. It typically has a higher upfront cost compared to other systems like HEPA Pod, but it offers advantages in terms of reduced labor costs over time and lower replacement component costs. This makes it a cost-effective option in the long run, especially when considering the total cost of ownership.
Q: What factors should I consider when performing a BIBO cost analysis?
A: When conducting a BIBO cost analysis, consider several key factors:
- Initial Investment: The purchase price of the BIBO system.
- Replacement Costs: The cost of replacing filters and other components over time.
- Labor Costs: The cost of changing filters, which can be higher due to the safety protocols.
- Waste Disposal: The cost associated with disposing of used filters.
- Energy Consumption: The ongoing energy costs related to operating the system.
Q: How does a BIBO ROI calculator help in evaluating filter systems?
A: A BIBO ROI calculator helps evaluate the return on investment by comparing the costs and benefits of BIBO systems against other filter systems. It considers factors like initial costs, maintenance expenses, and energy efficiency to provide a comprehensive view of how BIBO systems can offer long-term savings and improved safety.
Q: What are the safety benefits of using a BIBO system?
A: BIBO systems provide enhanced safety during filter changes by:
- Reducing Exposure: Minimizing the risk of exposure to hazardous materials.
- Containment Validation: Ensuring that the system is properly sealed to prevent leaks.
- Single-Fault Tolerance: Designing systems to maintain function even if a single component fails.
Q: How often should I replace BIBO filters to maximize ROI?
A: The frequency of replacing BIBO filters depends on usage and environmental conditions. Regular maintenance and monitoring can help determine the optimal replacement schedule, ensuring that you maximize the ROI by balancing filter performance with replacement costs. Proper maintenance also helps in extending the filter’s lifespan, reducing overall costs.
Q: Can BIBO systems be integrated with other air filtration technologies for enhanced performance?
A: Yes, BIBO systems can be integrated with other air filtration technologies to enhance performance. This integration allows for more comprehensive air purification, combining the safety and containment benefits of BIBO with the efficiency of other filtration methods. Such integration can lead to improved air quality and reduced operational costs over time.
External Resources
- Cleanroom Equipment Pricing | Budget Planning | Cost Comparison – Provides a detailed cost analysis for cleanroom equipment, including BIBO filter systems, with considerations for phased implementation, regional pricing differences, and ROI implications.
- Cleanroom Equipment Cost Analysis | ROI Calculator 2025 – Youth – Focuses on cost analysis for cleanroom equipment, highlighting how inaccurate projections can impact budgets and offering ROI guidance for filtration systems.
- ROI Savings Calculator | Harvard Corporation – Offers an ROI calculator specifically designed to analyze the present and future costs of operating various equipment, which can be adapted for filter systems.
- ROI Calculator – Permatron – Features a flexible ROI calculator that estimates potential savings over five years for filtration products, supporting investment decisions in filter systems.
- The Cost-Benefit Analysis of Investing in High-Quality Water Filters – Examines both financial and operational benefits of investing in advanced filtration systems, providing a comprehensive cost-benefit analysis and discussion of ROI.
- Cleanroom Equipment Cost Analysis by YOUTH Clean Tech – Explains total cost of ownership considerations, including capital expense, maintenance, and lifecycle costs for BIBO systems and other cleanroom filtration technologies.
Related Contents:
- Calculating ROI for Bio-safety Isolation Damper Upgrades
- cRABS or Isolators: Cost Analysis for Pharma Facilities
- Calculating ROI for In Situ Filtration Systems
- Emerging Trends: The Future of BIBO Technology
- The ROI of cRABS: Calculating Long-Term Value in Pharma
- Safe Hazardous Material Handling with BIBO
- Pharmaceutical BIBO Applications | Cleanroom Filter Management
- Nuclear Grade BIBO Systems | Radioactive Containment Solutions
- OEB Isolator ROI: Comprehensive Cost-Benefit Analysis

