What Causes Pressure Drop in Bio-safety Dampers?

Understanding Bio-Safety Isolation Dampers: Function and Importance

Working in containment laboratory design for over a decade, I’ve witnessed firsthand how seemingly minor components can significantly impact an entire facility’s safety profile. Bio-safety isolation dampers might not get the same attention as HEPA filters or biosafety cabinets, but they’re absolutely critical to maintaining proper containment.

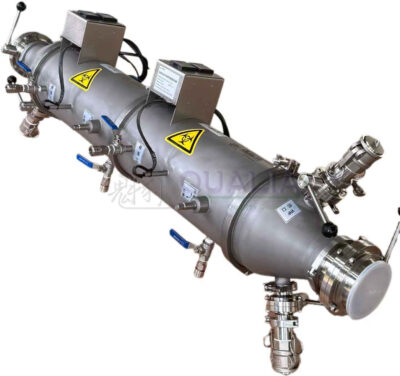
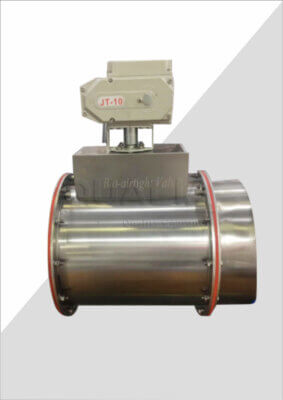
These specialized dampers serve as controlled barriers within the air distribution system of biological containment facilities. Unlike standard HVAC dampers, bio-safety isolation dampers are engineered specifically to meet the rigorous demands of containment laboratories where preventing cross-contamination is paramount. They effectively isolate various zones within facilities, controlling airflow directionally to maintain pressure relationships that keep potentially hazardous materials contained.

The design of these dampers incorporates several key components that distinguish them from conventional options. Most feature bubble-tight seals, low-leakage construction, and robust actuation mechanisms that ensure reliable operation even during power failures. The blade designs are particularly important – typically utilizing opposed or parallel configurations with specialized edge seals.

From a regulatory perspective, these components must meet stringent requirements specified by organizations like the NIH, CDC, and WHO. The NIH Design Requirements Manual explicitly addresses isolation damper specifications for various biosafety levels. As Section 6.6 of the manual notes, “Isolation dampers in BSL-3 and higher applications shall be bubble-tight with demonstrated leakage rates below acceptable thresholds.”

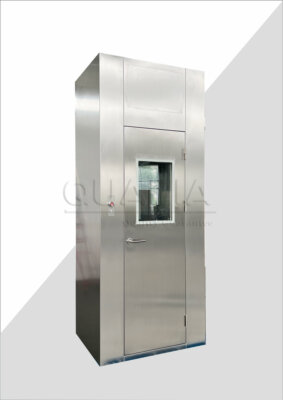
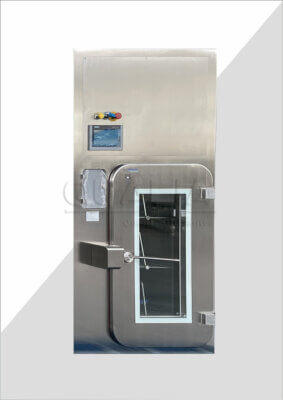
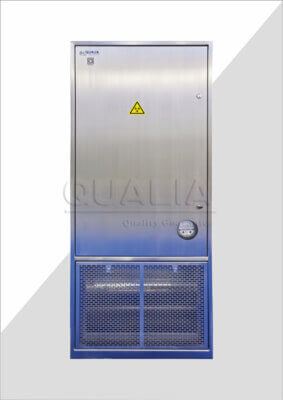
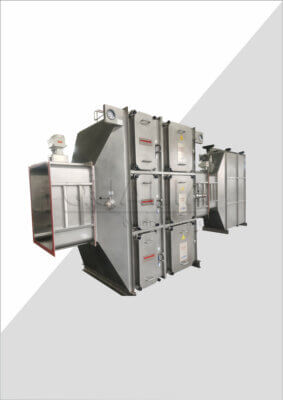
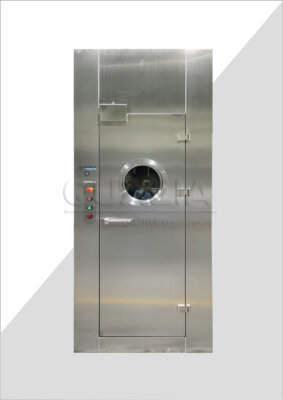
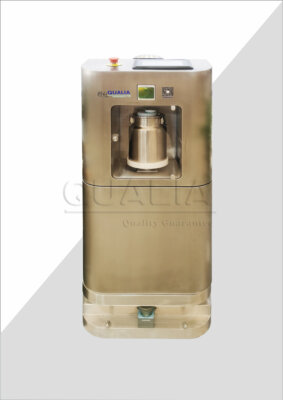
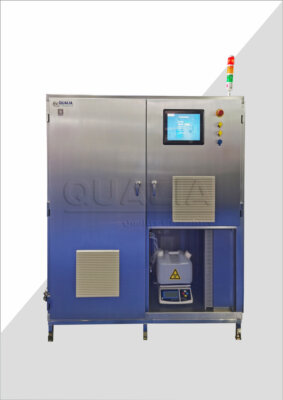
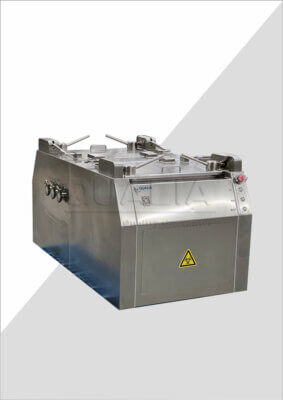
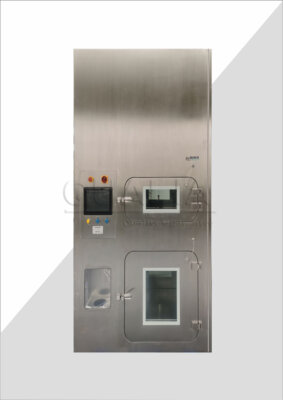
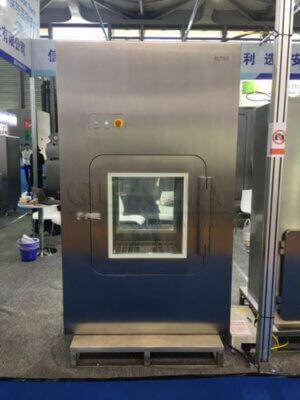
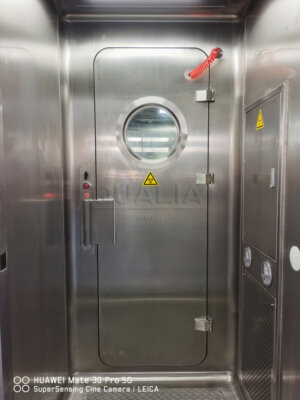
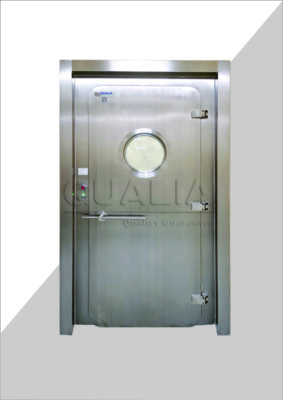
While examining QUALIA‘s bio-safety isolation dampers recently, I noticed their emphasis on both sealing technology and pressure drop performance – a difficult balance to achieve in practice. This correlation between containment efficacy and pressure drop represents one of the fundamental challenges in laboratory design.

BSL-3 and BSL-4 laboratories typically require multiple isolation points with redundant dampers to achieve the safety factors specified by regulatory guidelines. Each of these isolation points contributes to the overall pressure drop in the system, making optimization critical for both safety and operational efficiency.

The Physics Behind Pressure Drop in Damper Systems

The pressure drop phenomenon in damper systems follows fundamental fluid dynamics principles that, while complex in their complete mathematical expression, follow relatively intuitive patterns. At its core, pressure drop represents energy lost as air moves through a restriction – in this case, a damper.

Bernoulli’s principle helps explain the relationship between velocity and pressure in this context. As air passes through a restriction like a partially closed damper, its velocity increases while static pressure decreases. The energy conversion creates turbulence and friction, resulting in pressure loss. This loss is not recovered downstream, representing a permanent pressure drop that the fan must overcome.

The relationship between flow rate and pressure drop follows a square function in most cases. Double the airflow, and you typically quadruple the pressure drop. This non-linear relationship explains why minor increases in required airflow can dramatically increase energy consumption in laboratory ventilation systems.

Pressure drop in these systems is typically measured in inches of water column (inWC) or Pascals (Pa), with 1 inWC equaling approximately 249 Pa. While these measurements might seem small, even minor pressure drop differences of 0.1-0.2 inWC can significantly impact system performance and energy usage over time. Consider that a typical laboratory air handling system might operate continuously for 8,760 hours annually, and these small inefficiencies compound substantially.

I recall a project where we were evaluating various bio-safety isolation damper options for a university research facility. The difference between two models amounted to just 0.15 inWC at design airflow, but our calculations showed this would translate to approximately $4,300 in additional annual energy costs. The pressure drop characteristics became a deciding factor despite the higher initial cost of the more efficient option.

Another important consideration is that pressure drop isn’t static throughout the damper’s range of motion. A damper at 90° (fully open) position typically exhibits its minimum pressure drop, while restrictions increase exponentially as the damper closes. This non-linear relationship creates challenges for control systems designed to maintain precise pressure relationships between spaces.

The physics of pressure drop also explains why larger dampers generally exhibit lower pressure drop characteristics than smaller ones at equivalent velocities. The increase in cross-sectional area reduces velocity, which has a squared effect on pressure drop. That’s why properly sizing isolation dampers remains critical for optimizing system performance.

Primary Causes of Pressure Drop in Bio-Safety Dampers

When investigating isolation damper pressure drop issues, I’ve found that several specific design elements contribute significantly to overall system resistance. Understanding these factors is crucial for both selecting appropriate equipment and troubleshooting performance problems.

The damper blade design and configuration represent perhaps the most influential factor. Opposed blade designs typically offer better control characteristics but often create higher pressure drop compared to parallel blade configurations. The blade profile itself—whether airfoil-shaped, flat, or curved—dramatically impacts airflow resistance. In my experience working with containment laboratories, airfoil blades consistently demonstrate 15-25% lower pressure drop compared to flat blades at equivalent flow rates.

Blade TypeRelative Pressure DropControl Precision일반적인 애플리케이션
Airfoil최저우수High-performance systems, energy-sensitive applications
Curved보통GoodGeneral containment, balanced cost/performance needs
Flat최고공정Lower-cost applications, where energy efficiency is secondary
Opposed ConfigurationHigher than parallel우수Applications requiring precise control
Parallel ConfigurationLower than opposedGoodApplications where minimizing pressure drop is priority

Seal integrity represents another critical factor affecting pressure drop. While bubble-tight seals are essential for containment, their design directly impacts airflow resistance. The compression mechanism, seal material durometer (hardness), and edge design all contribute to the overall pressure profile. The high-performance isolation dampers I’ve worked with recently utilize specialized silicone edge seals that maintain containment integrity while minimizing resistance to airflow.

Clearances between moving parts present an interesting challenge. Tighter tolerances improve sealing capability but can increase friction and pressure drop. This relationship demands careful balance from manufacturers, particularly for components that change positions frequently. I’ve observed that dampers with precision-machined bearing surfaces typically demonstrate more consistent pressure drop characteristics over their operational lifetime.

Material selection plays a subtle but important role as well. Surface roughness of the internal components creates friction that contributes to pressure loss. Anodized aluminum components, for example, generally create less turbulence than galvanized steel surfaces. Some manufacturers now offer specialized low-friction coatings specifically designed to reduce pressure drop without compromising containment.

Frame design influences pressure drop through its impact on the effective free area. Dampers with minimized frame profiles maximize the available cross-sectional area for airflow, reducing velocity and consequently pressure drop. The structural requirements for bio-safety applications, however, often necessitate robust frames that reduce this free area.

An often-overlooked factor is the transition geometry at the inlet and outlet of the damper assembly. Abrupt changes in cross-sectional area create turbulence and increase pressure losses. The most effective designs incorporate gradual transitions that minimize these disruptions. During a recent laboratory design review, we identified poorly designed inlet transitions that were contributing nearly 0.2 inWC of unnecessary pressure drop—a significant amount in a precision containment system.

Actuator placement and linkage design can also influence pressure drop characteristics. External actuators with streamlined mounting arrangements minimize obstruction to airflow, while internal mechanisms, though protected from the environment, may create additional restrictions.

Installation Factors Affecting Pressure Drop

In my consulting work, I’ve repeatedly observed how installation practices can dramatically affect isolation damper pressure drop performance. Even the highest-quality components can underperform when improperly installed.

Ductwork configuration proximal to the damper assembly plays a particularly significant role. Ideally, dampers require straight duct runs of 3-5 duct diameters upstream and 1-3 diameters downstream to achieve published performance specifications. During a recent BSL-3 laboratory commissioning, we identified excessive pressure drop caused by a 90° elbow located just 12 inches upstream of an isolation damper. The resulting turbulence increased the measured pressure drop by approximately 35% compared to the manufacturer’s published data.

The mounting orientation relative to airflow direction is another critical factor that’s surprisingly often overlooked. Most bio-containment isolation dampers are designed and tested for specific mounting orientations. Installing a damper in a vertical duct when it was designed for horizontal placement can significantly alter its pressure drop profile. I’ve seen cases where improper orientation doubled the expected pressure loss across a damper assembly.

Duct connection methods also influence system performance. Flanged connections with gaskets typically create less turbulence than slip connections with exposed sheet metal edges. During a recent renovation project, replacing standard slip connections with flanged transitions reduced system pressure drop by nearly 0.3 inWC – a substantial improvement that allowed for downsizing of supply fans.

Sealing practices between the damper frame and ductwork significantly impact both leakage rates and pressure drop characteristics. Inconsistent or improper sealant application creates irregularities that disrupt laminar flow. Best practices include:

  • Using appropriate sealant compatible with containment requirements
  • Ensuring uniform application around the entire perimeter
  • Allowing proper cure time before system operation
  • Verifying seal integrity through appropriate testing methods

Supporting structures and reinforcement methods can inadvertently create obstructions that increase pressure losses. I recall a particularly challenging project where well-intentioned additional reinforcement of ductwork near isolation dampers created internal obstructions that increased system pressure drop by approximately 20%.

Access requirements for inspection and maintenance must be considered in relation to pressure drop. While necessary for operational purposes, access doors and panels interrupt the smooth interior surfaces of ductwork systems. Strategically locating these features to minimize airflow disruption helps maintain optimal pressure characteristics.

Multi-section damper assemblies require particular attention to alignment during installation. Even slight misalignment between sections creates turbulence that increases pressure drop. During factory acceptance testing of large assemblies, I’ve observed pressure drop differences exceeding 25% between properly and improperly aligned multi-section units.

System-Level Causes of Elevated Pressure Drop

Looking beyond the damper itself, numerous system-level factors contribute to elevated pressure drop in bio-containment applications. These factors often interact in complex ways that can be difficult to isolate during troubleshooting.

Filter loading represents one of the most common and predictable causes of increasing pressure drop over time. As HEPA and pre-filters accumulate particulate matter, their resistance to airflow progressively increases. This phenomenon creates a moving baseline for system pressure drop that must be accounted for during design. I typically recommend designing for approximately 50-75% of maximum filter loading conditions to balance energy efficiency with maintenance intervals.

필터 유형Initial Pressure DropDesign Pressure DropFinal Pressure DropTypical Replacement Interval
Pre-filter (MERV 8-13)0.2-0.4 inWC0.5-0.7 inWC0.8-1.0 inWC3~6개월
HEPA (99.97% @ 0.3μm)0.8-1.2 inWC1.5-2.0 inWC2.5-3.0 inWC1-3년
ULPA (99.999% @ 0.1-0.2μm)1.0-1.5 inWC1.8-2.5 inWC3.0-4.0 inWC2-4년
Carbon/Specialty0.3-0.8 inWC0.6-1.2 inWC1.0-2.0 inWCBased on challenge load

Simultaneous operation of multiple isolation dampers creates complex system effects that can increase pressure drop beyond simple additive calculations. During a recent commissioning project for a large biocontainment facility, we observed that when certain combinations of isolation dampers operated simultaneously, the measured system pressure drop exceeded calculated values by approximately 15%. This phenomenon results from the interaction of turbulent flow patterns that compound rather than simply combine.

The condition of existing ductwork in renovation projects presents unique challenges. Years of operation often lead to internal contamination, corrosion, and physical damage that increases surface roughness and creates pressure inefficiencies. Before specifying new isolation dampers for a laboratory renovation, I always recommend inspection and potential cleaning of existing distribution systems.

Control system programming significantly impacts both instantaneous and long-term pressure drop profiles. Improperly tuned PID loops can cause excessive damper movement, creating unnecessary turbulence and wear. I’ve observed systems where aggressive control parameters caused dampers to constantly “hunt” for setpoint, never achieving steady-state operation and creating approximately 0.2 inWC of additional system pressure drop.

Seasonal environmental changes affect air density, which directly impacts pressure relationships. A system properly balanced during winter commissioning may exhibit significantly different pressure drop characteristics during summer operation. This variability can be particularly problematic in facilities requiring precise pressure relationships between spaces.

System diversity factors also influence pressure drop characteristics. Most bio-containment systems are designed for worst-case scenarios where all isolation dampers may operate simultaneously. In practice, however, typical operation might involve only a subset of dampers. This creates challenges for designing optimal system pressure capabilities that balance energy efficiency with operational requirements.

Age-related deterioration of damper components gradually increases pressure drop over time. Bearing surfaces wear, seals compress permanently, and actuator performance degrades. During a recent energy audit of a 15-year-old containment facility, we identified that age-related degradation had increased system pressure drop by approximately 22% compared to original commissioning data.

Measuring and Calculating Pressure Drop

Accurate measurement and calculation of isolation damper pressure drop is essential for both troubleshooting existing systems and designing new installations. The process requires specialized instrumentation and careful attention to methodology.

Static pressure measurement represents the foundation of pressure drop analysis. Using calibrated manometers or differential pressure transducers, technicians measure pressure at points upstream and downstream of the damper assembly. The difference between these measurements constitutes the basic pressure drop value. However, this straightforward approach can be misleading without accounting for velocity pressure effects.

For comprehensive analysis, total pressure measurements provide more accurate data. This approach accounts for both static and velocity pressure components using Pitot tube traverses or similar methodologies. The equation Pt = Ps + Pv forms the basis for these calculations, where Pt represents total pressure, Ps represents static pressure, and Pv represents velocity pressure.

When evaluating field measurements, I typically use this formula to calculate expected pressure drop:

ΔP = C × (ρ × V²)/2

Where:

  • ΔP is pressure drop
  • C is the loss coefficient (specific to damper design)
  • ρ is air density
  • V is velocity

The loss coefficient varies significantly based on damper position, design, and installation factors. Manufacturers of quality bio-safety dampers typically provide detailed pressure drop data across various operating conditions. These “performance curves” allow for accurate prediction of pressure losses at different flow rates and damper positions.

When conducting field measurements, several best practices help ensure accurate results:

  1. Measure at consistent locations – typically 2-3 duct diameters upstream and 6-10 diameters downstream
  2. Use traverse methods that account for velocity profiles across the duct cross-section
  3. Take multiple measurements under identical operating conditions
  4. Correct for standard air density if operating in non-standard conditions
  5. Verify sensor calibration before critical measurements

During a recent commissioning project, we encountered significant discrepancies between measured and expected pressure drop values. By implementing a comprehensive measurement protocol with air velocity traverses at standardized points, we identified installation issues that were creating turbulent flow patterns and artificially increasing pressure drop.

For complex systems, computational fluid dynamics (CFD) analysis provides valuable insights into pressure relationships that are difficult to measure directly. While expensive and time-consuming, CFD modeling can reveal problematic flow patterns, recirculation zones, and other phenomena that contribute to excessive pressure drop.

When interpreting pressure drop data, context matters significantly. A damper exhibiting 0.5 inWC pressure drop might be perfectly acceptable in a general ventilation system but problematic in a high-containment laboratory where energy efficiency is critical. Evaluating measurements against both design intent and industry standards provides necessary perspective.

Strategies for Minimizing Pressure Drop in Bio-Safety Applications

Implementing effective strategies to minimize isolation damper pressure drop requires balancing multiple factors including safety, energy efficiency, and practical constraints. Through years of laboratory design experience, I’ve developed approaches that address this challenge systematically.

Proper sizing represents the foundation of an optimized system. Oversized dampers reduce face velocity, which has a squared relationship with pressure drop. However, this approach requires careful balance – excessively large dampers increase cost and space requirements while potentially reducing control precision. I typically aim for face velocities between 1200-1500 fpm for optimal performance, though specific applications may warrant different targets.

Strategic placement within the air distribution system significantly influences overall pressure characteristics. Locating isolation dampers away from turbulence-inducing elements like elbows, transitions, and branch connections helps maintain laminar flow and minimize pressure losses. During design review, I recommend maintaining minimum straight duct runs of:

  • Upstream: 3-5 duct diameters (or equivalent dimensions for rectangular ducts)
  • Downstream: 1-3 duct diameters

Material selection plays a subtle but important role in pressure optimization. Low-friction internal surfaces reduce turbulence and associated pressure losses. Advanced isolation dampers with specialized surface treatments can reduce system pressure drop by 5-10% compared to standard materials. This becomes particularly important in systems with multiple dampers where these small differences compound significantly.

Aerodynamic blade profiles offer substantial pressure drop advantages over traditional flat blade designs. Modern airfoil-shaped damper blades can reduce pressure drop by up to 25% compared to conventional options. While these designs typically increase initial cost, the energy savings often provide rapid payback, particularly in systems operating continuously.

Actuator selection and mounting arrangements influence both pressure performance and reliability. Externally mounted actuators minimize obstruction to airflow, while robust internal mounting protects components from potential contamination. This tradeoff requires careful evaluation based on specific application requirements.

Maintenance practices significantly impact long-term pressure drop characteristics. Regular inspection and maintenance of bearing surfaces, seals, and actuation mechanisms prevents deterioration that progressively increases pressure losses. My recommended maintenance protocol includes:

  • Quarterly visual inspection
  • Semi-annual operational verification
  • Annual comprehensive inspection and lubrication
  • Replacement of wear components based on manufacturer recommendations

System-level approaches like pressure-independent control strategies can minimize unnecessary pressure drop by operating dampers at optimal positions whenever possible. By integrating airflow measurement stations with sophisticated control algorithms, these systems maintain required containment relationships while minimizing energy consumption.

For retrofit applications where space constraints limit traditional solutions, specialized low-profile damper designs provide alternatives. Though typically more expensive, these components offer pressure drop characteristics approaching standard designs while accommodating tight installation parameters.

Training operational staff about the impact of their actions on system pressure drop pays significant dividends. Simple practices like scheduling filter changes based on pressure drop rather than calendar dates can substantially reduce system energy consumption. During a recent training session for laboratory facility managers, we calculated that optimizing filter change schedules based on pressure drop measurements rather than fixed intervals could reduce annual energy costs by approximately 8%.

Case Study: Overcoming Pressure Drop Challenges in a BSL-3 Laboratory Retrofit

A few years ago, I consulted on a challenging BSL-3 laboratory retrofit at a major research university. The project involved converting existing BSL-2 space to BSL-3 capability while working within significant physical and budgetary constraints. The existing air handling systems were near capacity, making minimization of additional pressure drop absolutely critical.

The initial design specified standard isolation dampers that would have added approximately 0.8 inWC of additional pressure drop to an already-constrained system. This approach would have necessitated replacement of the existing air handling equipment—a significant cost impact and schedule disruption the project couldn’t accommodate.

Our team conducted a comprehensive analysis of the existing system, identifying multiple areas where pressure optimization could potentially eliminate the need for equipment replacement. The isolation dampers represented the single largest opportunity for improvement. After evaluating multiple options, we specified high-efficiency bio-safety isolation dampers with aerodynamic blade profiles and optimized frame designs.

The implementation wasn’t without challenges. The building’s existing ductwork configuration created less-than-ideal installation conditions, with limited straight runs available for damper placement. We addressed this through careful computational fluid dynamics (CFD) modeling to identify optimal locations that minimized turbulence-induced pressure losses.

Another significant challenge involved the control system integration. The existing controls operated on a different protocol than the new isolation dampers required. Rather than replacing the entire system, we implemented gateway interfaces that allowed seamless communication while preserving the university’s existing building automation architecture.

The results exceeded expectations. The optimized isolation dampers reduced projected pressure drop by approximately 0.4 inWC compared to the original specification. Combined with other system optimizations, this eliminated the need for air handling equipment replacement—saving approximately $380,000 in project costs and reducing the schedule by nearly two months.

Post-implementation testing confirmed that the system not only met but exceeded containment requirements while maintaining energy efficiency. Measured pressure drop across the isolation dampers averaged 0.35 inWC at design airflow—approximately 15% better than even the manufacturer’s published data. This performance margin provided valuable operational flexibility for the facility.

The long-term benefits proved equally impressive. Energy modeling indicated annual operating cost savings of approximately $32,000 compared to the original design approach. This efficiency resulted primarily from the reduced fan energy required to overcome system pressure drop. The maintenance team reported excellent reliability, with no containment failures or significant issues during the first three years of operation.

This project demonstrated how strategic focus on isolation damper pressure drop can transform challenging retrofit projects from potentially infeasible to highly successful. The approach required multidisciplinary collaboration between architects, engineers, control specialists, and laboratory safety officers—highlighting the importance of integrated design in addressing complex technical challenges.

Balancing Safety and Efficiency in Isolation Damper Selection

When evaluating isolation dampers for biocontainment applications, the relationship between safety performance and energy efficiency creates an important decision matrix. While absolute containment remains the non-negotiable priority, achieving this without excessive pressure drop represents the ideal outcome.

The regulatory landscape establishes minimum requirements but doesn’t necessarily optimize for energy performance. NIH guidelines, for example, specify maximum allowable leakage rates for isolation dampers but don’t address pressure drop directly. This creates situations where components may meet safety requirements while imposing unnecessary energy penalties.

During specification development, I’ve found that a performance-based approach yields better results than prescriptive requirements. Rather than simply specifying “bubble-tight” or “low-leakage” characteristics, comprehensive specifications should address:

  • Maximum allowable pressure drop at design airflow
  • Acceptable leakage rates at specified pressure differentials
  • Minimum cycle life before maintenance
  • Required fail-safe positions and response times
  • Material compatibility with decontamination protocols

This balanced approach encourages manufacturers to optimize across multiple parameters rather than focusing solely on containment metrics at the expense of energy efficiency.

Advanced testing protocols help verify real-world performance before installation. Factory acceptance testing that includes both pressure drop and leakage evaluation provides valuable data for predicting system performance. I typically require:

  • Pressure drop testing at multiple airflow rates (50%, 75%, 100%, and 125% of design)
  • Leakage testing at maximum design differential pressure
  • Cycle testing to verify consistent performance over time

Understanding the trade-offs between different isolation damper designs helps inform appropriate selection. Bubble-tight dampers with redundant sealing mechanisms provide excellent containment but typically create higher pressure drop compared to standard low-leakage options. For critical containment barriers where absolute isolation is essential, this trade-off is warranted. For secondary or tertiary containment layers, however, less restrictive options may provide adequate safety with improved energy performance.

The operational profile of the facility significantly impacts optimal selection. Facilities operating 24/7 with continuous airflow justify higher initial investment in low-pressure components due to ongoing energy savings. Conversely, facilities with intermittent operation may benefit from different optimization priorities.

I’ve observed that coordination between mechanical and laboratory planning teams often identifies opportunities for strategic damper placement that improves both safety and efficiency. By carefully mapping containment boundaries and air exchange requirements, unnecessary redundancies can sometimes be eliminated while maintaining required safety factors.

The trend toward sustainable laboratory design has accelerated development of innovative isolation damper technologies. Recent advancements include hybrid designs that combine the sealing performance of bubble-tight dampers with the pressure characteristics approaching standard control dampers. While these advanced components typically carry premium pricing, their performance characteristics often justify the investment for new construction and major renovations.

Throughout my career designing biological containment facilities, I’ve found that informed selection of isolation dampers represents one of the most impactful decisions affecting both safety performance and operational efficiency. By understanding the principles governing pressure drop and applying thoughtful specification and selection processes, laboratory designers can achieve optimal outcomes that protect both research personnel and operational budgets.

Frequently Asked Questions of Isolation damper pressure drop

Q: What are isolation dampers and how do they affect pressure drop?
A: Isolation dampers are mechanical devices designed to fully open or close, controlling airflow in ducts or pipelines. The pressure drop across these dampers occurs due to resistance when airflow is reduced or blocked, impacting system efficiency. Proper design and sizing are critical to minimize pressure loss while ensuring effective isolation.

Q: What factors contribute to pressure drop in isolation dampers?
A: Pressure drop in isolation dampers is influenced by factors such as the entering flow profile, free area ratio of the damper, and exit conditions. Additionally, damper geometry and system conditions like differential pressure across the damper also play significant roles.

Q: How does the type of isolation damper affect pressure drop?
A: Different types of dampers, such as butterfly or vane control dampers, have varying effects on pressure drop due to their design and operation. Butterfly dampers, for instance, can provide a good flow control but might have higher pressure losses compared to vane control dampers.

Q: Can isolation damper pressure drop be optimized?
A: Yes, pressure drop can be optimized by ensuring proper sizing, selecting the right damper type for the application, and maintaining a balance between flow control and pressure loss. Regular maintenance of damper components can also reduce unwanted pressure drops.

Q: What is the role of damper authority in managing pressure drop?
A: Damper authority is crucial as it determines how well a damper can control airflow and manage pressure drop within a system. Higher damper authority means greater control over pressure drop, but excessively high values can lead to noise issues and increased energy consumption.

Q: How does leakage affect pressure drop in isolation dampers?
A: In isolation dampers, leakage can significantly impact the effective pressure drop. Leaks allow air to bypass the damper, reducing its efficacy in controlling airflow. Ensuring tight seals, particularly in bubble-tight or zero-leakage applications, is essential to maintain optimal performance and minimize unwanted pressure drops.

외부 리소스

  1. Connols-Air – This resource discusses isolation dampers with low pressure drop due to specific design features such as blade seals, which reduce operating torque and ensure low internal leakage.

  2. Halton – While not specifically discussing pressure drop, this resource details a zero-leakage isolation damper designed for applications requiring tight shut-off, which implies minimal pressure drop due to effective sealing.

  3. Greenheck – This blog provides insights into industrial isolation dampers, discussing their roles and leakage standards, though not explicitly focusing on pressure drop.

  4. Belimo – Although not exclusively about isolation dampers, this resource discusses general damper pressure losses, which can be relevant for understanding isolation damper performance.

  5. Newsstand – This article discusses pressure drop in HVAC systems, including how dampers contribute to it, but does not focus specifically on isolation dampers.

  6. Fan Applications and Pressure Drop – This resource provides broader insights into pressure drop in air-moving systems, which can be applied to the context of isolation dampers by understanding overall system dynamics.

맨 위로 스크롤
OEB4/OEB5 Isolator Pressure Monitoring: Key Features | qualia logo 1

지금 문의

직접 문의하세요: [email protected]

이 양식을 작성하려면 브라우저에서 JavaScript를 활성화하세요.
확인란